Showing posts with label predictions. Show all posts

Wednesday, October 12, 2022

Jamie Dimon: don’t be surprised if the S&P 500 loses another one-fifth of its value

 (Bloomberg) -- Jamie Dimon says don’t be surprised if the S&P 500 loses another one-fifth of its value. While such a plunge would fray trader nerves and stress retirement accounts, history shows it wouldn’t require any major departures from past precedents to occur.

Judged by valuation and its impact on long-term returns, the JPMorgan Chase chief executive officer’s “easy 20%” tumble, mentioned in a CNBC interview yesterday, would result in a bear market that is in many regards normal. A decline roughly to 2,900 on the S&P 500 would leave the gauge 39% below its January high, a notable collapse but one that pales next to both the dot-com crash and global financial crisis.

The price implied in Dimon’s scenario is roughly the index’s peak from 2018, the year when President Donald Trump’s corporate tax cuts took effect and an equity selloff forced the Federal Reserve to end rate hikes. Rolling back the gains since then would leave investors with nothing over four years, a relatively long fallow period. But, given the force of the bull market that raged before then, it would cut annualized gains over the past decade only to about 7%, in line with the long-term average.

Friday, November 5, 2021

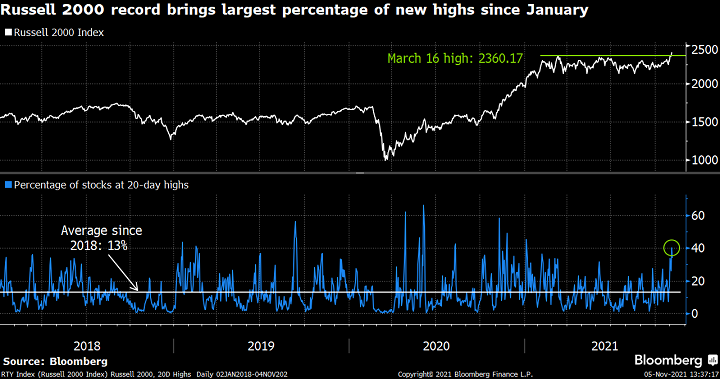
Broader Russell 2000 gains are seen as economic positive

Smaller U.S. companies are sending a positive signal for the economy, according to Chris Verrone, head of technical and macro research at Strategas Research Partners LLC. He cited broadening gains within the Russell 2000 Index in a Twitter post Thursday. More than 40% of the Russell’s component stocks closed at 20-day highs Wednesday as the index set a record, according to data compiled by Bloomberg. The percentage was the largest since January and more than triple the average since 2018.


** 7 months later **

Friday, August 6, 2021

S&P 500 is seen reaching 6,000 in 2025

Wall Street strategists are making increasingly optimistic predictions for the S&P 500 Index, which closed Thursday at 4,429.10. Goldman Sachs Group Inc.’s David Kostin is now calling for 4,900 at the end of next year. Yardeni Research Inc.’s Edward Yardeni is targeting 5,000. Leuthold Group Inc.’s Jim Paulsen is looking out further, to 2025, and seeing a bigger round number: 6,000. Paulsen raised the possibility in a report Thursday that assumed the U.S. economy will grow for the next four years. His projection values the S&P 500 at 20 times earnings per share of $300.


Thursday, December 17, 2020

Gold-mining stocks on the verge of a bull run?

Gold miners are about as cheap in relative terms as they have been in 20 years, according to Andrew Garthwaite, a global strategist at Credit Suisse Group AG. Garthwaite cited the stocks’ valuation, based on projected earnings, in a report Wednesday that predicted “a strong bull market” for the precious metal.


The forward price-earnings ratio for an MSCI global gold-mining index was 36% lower as of Wednesday than the ratio for the MSCI All-Country World Index of developed and emerging markets, according to data compiled by Bloomberg. Two years ago, gold stocks’ forward P/E was 65% higher.


*** GDX 20 months later ***

Monday, October 12, 2020

U.S. bank, housing stock divide looks short-lived to BofA

Record-setting gains for shares of U.S. homebuilders are at odds with weakness in bank stocks, according to Michael Hartnett, Bank of America Corp.’s chief global investment strategist. Hartnett compared S&P 500 indexes for the builders and lenders in a report Friday. The housing index climbed 38% for the year through Friday and ended last week at a record, according to data compiled by Bloomberg. The bank index, by contrast, fell 33%. Based on the groups’ historical tendency to move in tandem, Hartnett wrote this about the outlook: “Either housing buckles or banks play catch-up.”

Tuesday, January 7, 2020

S&P 500 valuation gauge challenges Internet-bubble highs

 U.S. stocks have “no room for error” after rising for more than a decade, according to Peter Boockvar, chief investment officer at Bleakley Advisory Group LLC. Boockvar cited the ratio between the S&P 500 Index’s enterprise value, reflecting debt and cash levels along with market value, and Ebitda -- earnings before interest, taxes, depreciation and amortization -- in an email Monday. The ratio spent multiple days above 14 last month for the first time since 2000, when an Internet-driven bubble in stocks burst, according to data compiled by Bloomberg. Tuesday’s reading was 14.1.

Thursday, January 10, 2019

Frontier-market stocks seen rising after lost decade

Frontier markets are poised to rise this year as they benefit from lower valuations and a “reasonably solid” economic outlook, according to Andrew Howell, a Citigroup Inc. equity strategist. 
  • Howell provided the view in a report released Wednesday. Any advance might be well received because these stocks have been through what can be considered a lost decade. The MSCI Frontier Markets Index rose just 9.5 percent from 2009 through 2018. 
  • During the same period, the MSCI Emerging Markets Index added 70 percent and the MSCI World Index of developed markets climbed 112 percent.

Monday, October 8, 2018

Emerging-market stocks look cheap to BlackRock

Emerging-market stocks have “restored a lot of value” after eight months of losses, according to Richard Turnill, BlackRock Inc.’s global chief investment strategist. Turnill compared the MSCI Emerging Markets Index’s forward price-earnings ratio, based on profit projections, with the ratio for the MSCI World Index of developed markets in a blog post Friday. Developing countries’ P/E discount widened to 29 percent Friday from this year’s low of 19 percent, set Jan. 26, as their MSCI index dropped 21 percent.

Tuesday, March 20, 2018

Medical devices look healthier than drug stocks

Investors seeking healthy gains in U.S. stocks are better off with medical-device makers than drug companies, according to Ari Wald, Oppenheimer & Co.’s chief technical analyst. Wald showed in a report Saturday how iShares exchange-traded funds for the industry groups did relative to the S&P 500 Index. The ratio between the iShares U.S. medical-devices and pharmaceuticals ETFs set a record Thursday after soaring 87 percent from a low in July 2015. 


Tuesday, January 12, 2016

The Royal Bank of Scotland: "Sell everything except high quality bonds"

The Royal Bank of Scotland tells investors to 'sell everything' in client note.  "Sell everything except high quality bonds," the note said, warning that the situation is similar to the global financial crisis that occurred in 2008.

  • market  4 years later **


Thursday, April 23, 2015

Lumber and gold are reasons for worry on U.S. stocks

(Bloomberg) -- Commodity markets are signaling that lower prices and bigger swings lie ahead for U.S. stocks, according to Charlie Bilello, research director at Pension Partners LLC.


This chart illustrates how Bilello reached his conclusion: by tracking the price relationship between lumber and gold. The chart displays a ratio of futures prices at the Chicago Mercantile Exchange and New York’s Comex, respectively. The Standard & Poor’s 500 Index is also provided for reference.

“When lumber is leading gold, volatility in equities tends to fall going forward,” Bilello wrote in a blog posting three days ago on his New York-based investment firm’s website. “When gold is leading lumber, the opposite is true.”

This year, the ratio has fallen as much as 27 percent as lumber futures have tumbled, reflecting a drop in U.S. housing starts. Gold, which many investors see as a haven in periods of economic and political turmoil, was little changed for the year as of yesterday.

While the S&P 500 gained 2.4 percent for the year through yesterday, the lumber-gold indicator shows investors need to be more defensive, Bilello wrote. “At the very least, if history is any guide, we should be prepared for higher volatility ahead,” he added.

The ratio is the subject of a paper by Bilello and Michael A. Gayed, chief investment strategist at Pension Partners, that won an award from the National Association of Active Investment Managers. The paper covers the use of the indicator to switch between stocks and Treasury securities, and will be published next month. An abstract is now available.

SPY : 23 Apr 2015

Tuesday, February 3, 2015

Byron Wien : 10 Surprises for 2015

This is the 30th year that Byron Wien has given his views on a number of economic, financial market and political surprises for the coming year. Wien, a senior advisor to Blackstone (ticker: BX ), defines a surprise as an event which the average investor would only assign a one out of three chance of taking place but which Byron believes has a better than 50% chance of happening.

1. The Federal Reserve finally raises short-term interest rates, well before the middle of the year, encouraged by the improving employment data and strong Gross Domestic Product growth. The timing proves faulty, however, as the momentum of the economy has begun to flag and a short-term slowdown has started. The end of monetary accommodation and rising rates precipitate a correction in equities. Long-term Treasury rates stay where they started and the yield curve flattens.
2. Our luck runs out on cyber terrorism. Hackers invade the personal and corporate accounts of a major money center bank and the Federal Reserve orders the institution to suspend transactions for five business days while the accuracy of its balances is verified. Various government departments and agencies are mobilized to deal with the problem caused by the hackers having proved to be more skillful than our corporate cyber security efforts.
3. The year-end 2014 rally in United States equities continues as the market rises for a strong performance in 2015. A growing economy, fueled by housing and capital spending and favorable earnings, enables the Standard & Poor’s 500 to increase 15% during the year, outperforming equities in most major industrialized countries throughout the world.
4. Mario Draghi finally begins to expand the balance sheet of the European Central Bank aggressively by buying sovereign debt, mortgages and corporate bonds. In spite of this expansion, Europe falls back into a serious recession. Germany is particularly weak as reduced demand from various trading partners has a major impact on its exports. The European policy makers fail to embrace the one option, fiscal spending, that could turn the economy around, and European stocks decline. Politically, Europe moves dangerously toward the right.
5. Shock and awe no longer works in Japan. The recession which began in the third quarter of 2014 continues throughout 2015 in spite of further fiscal and monetary stimulus and the suspension of the second planned sales tax increase. The Nikkei 225 is flat for the year in yen and down in dollars.
6. China reports that it is no longer growing at 7% and that more fiscal and monetary stimulus is needed to grow at even 5% and to prevent a hard landing. It also acknowledges that it must rebalance the economy toward the consumer and away from credit-based investing in state-owned enterprises and infrastructure. What money is spent on infrastructure is focused on air, water and ground pollution, not roads and housing. A lower rate of job creation leads to protests but they are contained without excessive violence.
7. The drop in the price of oil finally has an impact on Iran. The country was dependent on its sale of crude to offset the impact of sanctions. The economic weakness resulting from the unexpected decline in oil finally forces a conciliatory attitude on the part of its nuclear negotiators. Pressure to cease nuclear weapons development comes from the Iranian people as well, as they seek more economic opportunity. An agreement to roll back its weapons program is greeted positively throughout the region and world equity markets rally briefly on the news.
8. Brent slips into the $40s. The low price of crude oil, which continues throughout the first part of the year, has a major impact on Russia. A peace settlement with Ukraine is signed, giving Eastern Ukraine substantial autonomy but guaranteeing the sovereignty of the rest of the country. President Putin seems to be trying to win back the respect of the international community as the country reels from its economic problems, but the Russian citizenry finally turns on him. His approval rating plummets and he resigns by year-end. During the second half of the year, West Texas Intermediate and Brent crude are both above $70, as emerging market demand continues to increase.
9. The year-end 2014 meltdown in the high yield market, as a result of the collapse in the price of oil, creates a huge buying opportunity. The spread between high yield and Treasurys is cut in half, and high yield becomes the best performer of the various asset classes as the U.S. economy continues to grow with no recession in sight.
10. The Republicans decide to position the party as the one that can get something done in Washington. They argue that President Obama was ineffective in his first six years, but when they got control of both the Senate and the House, legislation was passed. The Keystone pipeline finally is approved, as well as minor tax code revisions and even some changes in immigration policy. The Republicans are determined to strengthen their position with Hispanics in 2016. They want desperately to hold the nation’s highest office and they see Jeb Bush as a winner for them.
Here are some “also ran” surprises.
11. Water becomes the central environmental issue of 2015, eclipsing carbon-caused air pollution. While a shortage of water has always been a potential problem in the Western United States, it becomes a source of considerable tension in India and China, where large parts of the population do not have safe drinking water on a consistent basis.
12. Internet commerce runs into trouble. Established hotels push legislators to make Airbnb pay the same taxes and fees that they are required to charge customers. Uber is asked by local authorities to prove that its drivers have commercial insurance to protect passengers. The stocks affected decline sharply.
13. Brazil provides an emerging market favorable surprise. President Dilma Rousseff abandons some of her long-held socialist ideas and moves to the center. She introduces a number of business-friendly policies and the economy improves. It is helped more than it is hurt by the drop in the oil price. Brazil becomes a favorite of emerging market investors once again.
14. I liked this one, but I didn’t have more than 50% conviction about it. Hillary Clinton decides not to run for President. She fears that Jeb Bush would siphon off some of the votes of Hispanics, who substantially voted for Obama. Many liberals are disenchanted with Clinton and may not vote for her. She wants to be the first woman President but she doesn’t want to lose.

Thursday, January 22, 2015

Goldman's underdog strategy : buy calls on these stocks in anticipation of an earnings relief rally

Goldman’s clients are being advised to buy call options on 15 stocks in anticipation of an earnings relief rally

At Goldman Sachs, strategists are reminding clients that a very basic strategy can be very profitable. The firm is telling clients that buying calls on stocks underperforming the stock market ahead of earnings has been almost twice as profitable as buying calls on stocks that outperformed the Standard & Poor’s 500 by 3% or more.

Since 1996, this basic trading strategy has outperformed the market 12 of 19 years by an average of 9%.

Goldman is advising clients to buy calls on 15 stocks in anticipation of an earnings relief rally. Stocks include
  1. Caterpillar ( CAT )  - Jan 27, before 
  2. Danaher ( DHR ) - Jan 27, before
  3. Viacom ( VIAB ) - Jan 29, before, 
  4. Ryland Group ( RYL ) - Jan 29, before, 
  5. Deckers Outdoor (DECK ) - Jan 29, after, 
  6. Mattel ( MAT ) - Jan 30, before, 
  7. CBRE Group ( CBG )- Feb 3, after, 
  8. Ralph Lauren ( RL ) - Feb 4, before, 
  9. Lions Gate Entertainment ( LGF ) - Feb 5, after, 
  10. Hasbro ( HAS ) - Feb 9, before, 
  11. Masco ( MAS ) - Feb 9, before, 
  12. Starwood Hotels & Resorts Worldwide ( HOT ) - Feb 10, before, 
  13. Time Warner ( TWX ) - Feb 11, before, 
  14. NetApp ( NTAP )- Feb 11, after, 
  15. Fossil Group ( FOSL ) - Feb 17, after, .
All tickers (change from open, new window):
CAT,DHR,VIAB,RYL,DECK,MAT,CBG,RL,LGF,HAS,MAS,HOT,TWX,NTAP,FOSL

by market cap:
       

John Marshall and Katherine Fogertey, Goldman’s derivatives strategists, recommended February expirations and strike prices that are aligned with the associated stock prices. For example, Fossil is expected to report earnings Feb. 17. The strategist picked the February $99.50 call when the stock was at $99.

Wednesday, July 9, 2014

Yardeni: Bull market entering its final (euphoric) phase [prediction]

The strategist writes that the last of four phases for the S&P 500, the "melt-up," probably began in May.
  • Editor's Note: Yardeni is president and chief investment strategist of Yardeni Research, a provider of independent strategy and economics research.
  • Below from Barron's 9 July 2014
In 1725, Antonio Vivaldi composed "The Four Seasons," a set of four violin concertos. The sounds of each concerto resembles its respective season. So for example, "Winter" is punctuated with pizzicato notes from the high strings, suggesting icy rain. "Summer" sounds like a thunderstorm in its final movement, which is often called "Storm."

One of the great virtuosos of the investment business was Sir John Templeton. He observed that bull markets experience four phases: pessimism, skepticism, optimism, and euphoria. Similarly, my friend Laszlo Birinyi has also identified four phases: reluctance, digestion, acceptance, and exuberance.


Where are we now in the current bull market? In my opinion, we are moving from the third to the fourth phase for the S&P 500. The first phase started on March 9, 2009 and ended after the second and worst correction of the bull market, on October 3, 2011. The second phase included three minor corrections, with the last one ending on June 1, 2012.

The third phase has had no corrections and is probably coming to an end now. It may be setting the stage for what can also be called the "melt-up" phase. The start of the fourth phase probably coincided with the bottom in the "internal correction" of the momentum stocks on May 8.

Adding to last week's lovefest for stocks was June's employment report. It was a strong one, which should have raised concerns that the Fed might have to start raising interest rates sooner rather than later. Indeed, the 10-year US Treasury bond yield has risen from the year's low of 2.44% on May 28 to 2.65% on Thursday. That's a relatively tame reaction given that the unemployment rate is down to 6.1%, the lowest since September 2008.

monthly


daily

However, wage inflation remains subdued at 2.0% despite the drop in the jobless rate. Since she became Fed chair earlier this year, Yellen has stated that she wants to see wage inflation rise to between 3%-4% before she'll be happy with the performance of the labor market. Of course, this is just one of the labor market indicators on Yellen's "dashboard." Some of the others show that the labor market is improving, but she is clearly giving more weight to wages. Let's review:

(1) The U-6 unemployment rate fell from 12.2% during May to 12.1% during June, the lowest since October 2008. (Editor's Note: The Bureau of Labor Statistics defines the U-6 rate as total unemployed, plus all marginally attached workers plus total employed part time for economic reasons, as a percent of all civilian labor force plus all marginally attached workers.)

(2) The long-term unemployment rate fell to 2.0% last month, the lowest since February 2009.

(3) The long-term unemployment as a percentage of total unemployment fell to 32.8% during June, the lowest since June 2009.

There were plenty of other upbeat employment indicators. Most importantly, our Earned Income Proxy (i.e., aggregate hours worked times average hourly earnings) rose 0.5% last month to another record high. It is highly correlated with both private wages and salaries in personal income and with retail sales.

Saturday, June 7, 2014

Misery index and stock valuation

Falling unemployment may sustain the bull market in U.S. stocks at least for another year, according to Edward Yardeni, president and chief investment strategist at Yardeni Research Inc.


The chart demonstrates the inverse relationship between the misery index, calculated by adding the jobless and inflation rates, and the Standard & Poor’s 500 Index’s valuation based on projected earnings.

Yardeni’s version of the misery index fell to 7.7 percent in April from a peak of 10.6 percent in September 2011, as the chart shows. He used a price gauge linked to consumer spending and excluding food and energy prices to track inflation.

The decline “certainly justifies the rebound” in the S&P 500’s estimated price/earnings ratio during the period, the New York-based strategist wrote. The index rose to 16.4 times profit yesterday from a low of 11 times at the start of October 2011, according to data compiled by Bloomberg.

Yardeni expects a lower unemployment rate to bring down the misery index further. He predicted that joblessness will slide to 5.5 percent by the middle of next year from April’s reading of 6.3 percent, matched in May.

“That should keep the bull running for another year, at least,” he wrote. “So while contrarians warn that there are too many bulls who will soon be immiserated, the misery index suggests that they should party on.”

Sunday, May 4, 2014

Prediction : S&P 500 bubble 20% away

The next bubble in U.S. stocks appears to be about 20 percent away, according to Jeremy Grantham, chief investment strategist at Grantham, Mayo, Van Otterloo & Co.


The chart depicts Grantham’s outlook for the Standard & Poor’s 500 Index, which he presented yesterday in a quarterly letter to investors. The chart also captures the S&P 500’s surge since the current bull market began in March 2009.

Stocks would enter a bubble with the index at 2,250, Grantham wrote, citing statistical analysis of earlier periods in which the prices of shares and other assets surged and then tumbled. Yesterday, the index closed at 1,883.68. The S&P 500 may start advancing there in October and exceed that level by the presidential election in November 2016, he wrote.

“I am sure it will end badly,” the Boston-based strategist wrote. The S&P 500 may lose half its value or even more, he added, unless the Federal Reserve finds ways to head off the plunge.

Grantham defined a bubble as “a 2-sigma event,” in which the value of the S&P 500 or another benchmark rises more than two standard deviations above its historical trend.

Bubbles occur more often than mathematics would suggest, the report said. GMO’s analysis found that they tend to happen every 31 years, sooner than the 44-year time span indicated by probability theory.

Friday, April 4, 2014

Utility leadership shows more U.S. stock risk

This year’s market-leading performance of U.S. utility stocks is a sign that the risk of losses is increasing, according to Charlie Bilello, director of research at Pension Partners LLC.


The Standard & Poor’s 500 Utilities Index ended yesterday’s trading with an 8.4 percent gain for 2014. The increase was the biggest among the 10 main industry groups in the S&P 500, which rose 2.2 percent.

“The wide outperformance of the utilities sector on a year-to-date basis is certainly alarming,” Bilello wrote in a posting yesterday on his firm’s blog. Lower prices and greater volatility may be in store, the New York-based analyst wrote.

     Utilities have been the top-performing S&P 500 group in three quarters since the current bull market started in March 2009. They came out on top in the second quarter of 2010, when the index fell 12 percent, and the third quarter of 2011, when it dropped 14 percent. Last quarter, they ranked first as the S&P 500 rose 1.3 percent.

     The current strength in utility stocks makes them a better investment than the S&P 500, Bilello wrote. He recommended them as part of a strategy of switching between the industry and the index that he developed with Michael Gayed, Pension Partners’ chief investment strategist.

     This “beta rotation strategy,” as they called it, was outlined in a paper that won the Charles H. Dow Award from the Market Technicians Association this week. The award, named for a co-founder of Dow Jones & Co., is given to recognize excellence and creativity in technical analysis.

Sunday, December 15, 2013

2013 -- A year to remember / 2014 predictions


Sector Snapshot
Only four sectors are beating the market this year, with consumer-discretionary in the lead. Bond-proxy sectors have been dragging.
Price Returns
S&P 500 SectorP/E*2013**201220112010
Consumer Disc16.935.1%21.9%4.4%25.7%
Health Care16.034.115.210.20.7
Industrials15.730.312.5-2.923.9
Financials12.928.226.3-18.410.8
Info Technology13.420.313.11.39.1
Consumer Staples16.620.37.510.510.7
Energy12.617.42.32.817.9
Materials15.315.812.2-11.619.9
Utilities14.86.6-2.914.80.9
Telecom14.03.612.50.812.3
S&P 50014.524.513.40.012.8
*Based on 2014 analysts' earnings estimates. ** Through 12/12.
Source: Bloomberg