Showing posts with label candlesticks. Show all posts

Friday, September 8, 2023

Candlesticks: Hammer

One of the most visually compelling candlestick patterns is the hammer signal. This signal is easily recognized by the lower shadow also known as the tail that protrudes to the downside after an extended downtrend.


The hammer signal is comprised of one candle and it is easily identified by the presence of a small body with a shadow at least two times greater than the body. It is found at the bottom of a downtrend and this shows evidence that the bulls started to step in. The color of the small body is not important but a white or green candle has slightly more bullish implications than a black or red body. A positive day is then required the following day to confirm this signal.
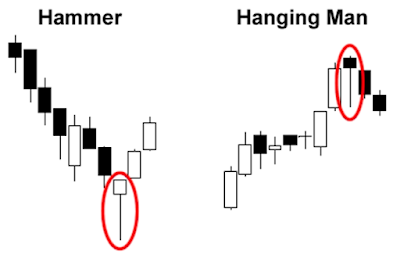
Criteria for the hammer signal

  • The lower shadow should be at least two times the length of the body.
  • The real body is at the upper end of the trading range. The color of the body is not important although a white or green body should have slightly more bullish implications.
  • There should be no upper shadow or a very small upper shadow.
  • The following day needs to confirm the hammer signal with a strong bullish day.

Signal Enhancements
  • The longer the lower shadow the higher the potential of a reversal occurring.
  • A gap down from the previous day’s close sets up for a stronger reversal move as long as the day after the Hammer signal opens higher.
  • Large volume on the Hammer day increases the chances that a blow-off day has occurred.
Pattern Psychology
After a downtrend has been in effect the atmosphere is very bearish. The price opens and starts to trade lower. The bears are still in control but the bulls then step in and they start to bring the price back up towards the top of the trading range. This creates a small body with a large lower shadow and represents that the bears could not maintain control. The long lower shadow now has the bears questioning whether the decline is still intact and a higher open the next day would confirm that the bulls had in fact taken control.

Thursday, September 22, 2022

Candlesticks: Bearish Engulfing

The bearish engulfing pattern is a major reversal pattern comprised of two opposite colored bodies. It is formed after an up-trend and it opens higher than the previous day’s close and closes lower than the previous day’s open. Therefore the black or red candle completely engulfs the previous day’s white or green candle. Engulfing can include either the open or the close and it must be equal to the open or close of the previous day, but not both.

Criteria for bearish engulfing pattern

  • The body of the second day completely engulfs the body of the first day. Shadows are not a consideration.
  • Prices have been in a definable uptrend even if it has been short term.
  • The body of the second candle is opposite color of the first candle with the first candle the color of the previous trend. The exception to this rule is when the engulfed body is a “doji” or an extremely small body.

Signal Enhancements for bearish engulfing pattern

  • A large body engulfing a small body. The previous day was showing the trend was running out of steam. The large body shows that the new direction has started with good force.
  • When the engulfing pattern occurs after a fast spike up there will be less supply of stock to slow down the reversal move. A fast move makes a stock price over-extended and increases the potential for profit taking and a meaningful pullback.
  • Large volume on the engulfing day increases the chances that a blow-off day has occurred.
  • The engulfing body engulfing more than one previous body demonstrates power in the reversal.
  • If the engulfing body engulfs the body and the shadows of the previous day the reversal has a greater probability of working.
  • The greater the open gaps up from the previous close the greater the probability of a strong reversal.

Pattern Psychology
After an uptrend has been in effect the price opens higher than where it closed the previous day. Before the end of the day the sellers have taken over and moved the price below where it opened the day before. The emotional psychology of the trend has now been reversed.

Tuesday, October 12, 2021

Candlesticks: Marubozu

  • very strong buying or selling pressure
A marubozu candle indicates a stock has traded strongly in one direction throughout the session and closed at its high or low price of the day.  The candle is represented only by a body; it has no wicks or shadows extending from the top or bottom of the candle.


A white marubozu candle has a long white body and is formed when the open equals the low and the close equals the high.  White marubozu is a bullish candle as it shows that buyers were in control the entire period of time. It is usually the first signal of a bullish continuation or a bullish reversal pattern.

Black marubozu is a bearish candle as it shows that sellers were in control the entire period of time. It is usually the first signal of a bearish continuation or a bearish reversal patter.

Finviz :


Thursday, July 1, 2021

Candlesticks: Bullish Harami

The bullish harami is often seen and is one of the 12 major candlestick patterns. This pattern is composed of a two-candle formation in a down-trending market. The body of the first candle is a long body and is the same color as the current trend while the second body is smaller. The open and the close occur inside the open and the close of the previous day.  The appearance of the bullish harami indicates that the trend is over. The Japanese definition for harami is pregnant woman or body within. The first candle is black or red which is a continuation of the existing trend. The second candle which is the little belly sticking out is usually white but not always. The location and size of the second candle will influence the magnitude of the reversal.

Criteria for Bullish Harami

  • The body of the first candle is black or red and the body of the second candle is white or green.
  • The downtrend has been evident for a good period since the long black or red candle occurs at the end of the trend.
  • The second day opens higher than the close of the previous day and closes lower than the open of the prior day.

Unlike the Western “Inside Day” just the body needs to remain in the previous day’s body, where as the “Inside Day” requires both the body and the shadows to remain inside the previous day’s body.
For a reversal signal further confirmation is required to indicate that the trend is now moving up.

Signal Enhancements
  • The longer the candle the more forceful the reversal.
  • The higher the white or green candle closes up on the black or red candle the more convinced we are that a reversal has occurred (despite the size of the white or green candle).

Pattern Psychology of the Bullish Harami
After a strong down-trend has been in effect and after a selling day the bulls open the price higher than the previous day’s close. The shorts get concerned so they start covering while the price finishes higher for the day. This is enough support to have the short sellers take notice that the trend has been violated. A strong day the following day convinces everyone that the trend was indeed reversing. Usually the volume is above the recent norm due to the unwinding of short positions.

Tuesday, May 4, 2021

Candlesticks: Bearish Harami

The bearish harami is one of the major candlestick patterns that displays common sense in graphic depiction. The elements that create a bearish harami produce clear insights into investor sentiment at a reversal.

Description
The Bearish Harami is the exact opposite of the bullish harami and its presence indicates that the trend is over. It is composed of a two-candle formation with the body of the first candle the same color as the current trend. The first body of the pattern is a long body and the second body is smaller. The open and the close occur inside the open and close of the previous day.

Criteria
  • The body of the first candle is white or green and the body of the second candle is black or red.
  • The uptrend is apparent and a long white or green candle occurs at the end of the trend.
  • The second day opens lower than the close of the previous day and closes higher than the open of the prior day.
  • Confirmation is needed for a reversal and the next day should show weakness.

Signal Enhancements
  • The longer the white or green candle and the black or red candle, the more forceful the reversal.
  • The lower the black or red candle closes down on the white or green candle, the more convincing it is that a reversal has occurred, despite the size of the black candle.

Pattern Psychology
After a strong uptrend has been in effect and after a long white or green candle day, the bears open the price lower than the previous close. The longs get concerned and begin profit taking as the price finishes lower for the day. The bulls are now concerned as the price closes lower and it has now become evident that the trend has been violated. A weak day following convinces everyone that the trend was reversing. Volume increases as a result of profit taking and the addition of short sales.

Harami signals provide an opportunity to maximize returns and they have excellent capabilities of indicating how strong the new trend to the upside will be. If all of your investment funds are currently fully used, the Harami may reveal that one of the positions has stalled for a few days. An aggressive trader may opt to move those funds to a better trade and then return in a few days to reinvest once the position is moving.

Tuesday, March 23, 2021

Candlesticks: Bullish Engulfing

The bullish engulfing signal may happen often as it is a major reversal pattern. It is comprised of two opposite colored bodies and it is formed after a downtrend. It opens lower than the previous day’s close and closes higher than the previous day’s open. Thus, the green candle completely engulfs the previous day’s red candle.

Criteria for bullish engulfing signal

  • The body of the second day completely engulfs the body of the first day. Shadows are not a consideration.
  • Prices have been in a definable down trend even if it has been short term.
  • The body of the second candle is opposite color of the first candle, with the first candle the color of the previous trend. The exception to this rule is when the engulfed body is a doji or an extremely small body.

Signal Enhancements for bullish engulfing signal

  • A large body engulfing a small body.
  • The previous day shows the trend was running out of steam. The large body shows that the new direction has started with good force.
  • When the engulfing pattern occurs after a fast move down, there will be less supply of stock to slow down the reversal move. A fast move makes a stock price over extended and increases the potential for profit taking.
  • Large volume on the engulfing day increases the chances that a blow-off day has occurred.
  • The engulfing body engulfs the body and the shadows of the previous day. The reversal has a greater probability of working.
  • The greater the open gaps down from the previous close the greater the probability of a strong reversal.

Pattern Psychology
After a downtrend has been in effect the price opens lower than where it closed the previous day. Before the end of the day, the buyers have taken over and moved the price above where it opened the day before. The emotional psychology of the trend has now been altered.

Wednesday, September 9, 2020

Candlesticks: Hanging Man

The hanging man is one of the 12 major candlestick patterns and it produces very important attributes when analyzing a potential reversal. This signal is comprised of one candle and it is easily identified by the presence of a small body with a shadow at least two times greater than the body. It is found at the top of an up-trend and the probability of making a correct trade  becomes extremely high when utilizing this signal. The Japanese named this pattern the hanging man because it looks like a head with the feet dangling down.
Criteria for hanging man
  • The upper shadow should be at least two times the length of the body.
  • The real body is at the upper end of the trading range. The color of the body is not important although a black or red body should have slightly more bearish implications.
  • There should be no upper shadow or a very small upper shadow.
  • To confirm the hanging man signal a black candle should be seen the following day. An even better confirmation of this signal is to see a gap down with a lower close.
Signal Enhancements
  • The longer the lower shadow the higher the potential of a reversal occurring.
  • A gap up from the previous day’s close sets up for a stronger reversal provided prices trade lower the day after the hanging man signal is formed.
  • Although it is not a necessity a large volume on the signal day increases the chances that a blow-off day has occurred.
Pattern Psychology
After a strong up-trend has been in effect the atmosphere is bullish. The price opens higher but then begins to move lower. The bears take control but before the end of the day the bulls step in and take the price back up to the higher end of the trading range. This creates a small body for the day and could indicate that the bulls still have control. The long lower shadow however represents that sellers have started stepping in at these levels. Even though the bulls may have been able to keep the price positive, by the end of the day the evidence of selling is apparent. A lower open or a black or red candle the following day reinforces the fact that selling continues.

The twelve major candlestick signals demonstrate the visual elements produced by human emotions. You can learn to correctly analyze what these emotions are doing at specific points of a trend. Use Japanese Candlesticks to profit from your investment decisions today!

Sunday, June 2, 2013

Candlesticks: Piercing Pattern

The piercing pattern is one of the 12 major candlestick patterns and it is a two-candle formation that occurs when the market is in a down trend. The first candle is black or red which is a continuation of the existing trend and the second candle opens below the low of the previous day. The piercing pattern closes more than midway up the black or red candle which is near or at the high for the day.

Criteria for piercing pattern
  • The body of the first candle is black or red and the body of the second candle is white or green.
  • The downtrend has been evident for a good period of time and a long black candle occurs at the end of the trend.
  • The second day opens lower than the trading of the prior day.
  • The white or green candle closes more than halfway up the black or red candle.

Signal Enhancements
  • The longer the candle the more forceful the reversal.
  • The greater the gap down from the previous day’s close the more pronounced the reversal.
  • The higher the white or green candle closes into the black or red candle the stronger the reversal.
  • Large volume during these two trading days is a significant confirmation.
Pattern Psychology
After a strong downtrend has been in effect the atmosphere is bearish. Fear becomes more predominant and the prices gap down. The bears may even push the prices down further however before the end of the day the bulls step in and dramatically turn prices around. The prices finish near the high of the day and the move has almost negated the price decline of the previous day. This now has the bears concerned. This move is confirmed by more buying the following day.

The psychology built into a major candlestick signal is simple common sense investment philosophy. When you learn how to utilize the candlestick signals correctly you now have the knowledge to improve your trading techniques for those trading entities you want to trade. You do not have to depend on canned programs that sometimes work and sometimes don’t work and you do not have to buy or sell stock recommendations blindly based on a research analyst’s recommendations. The candlestick signals provide guidance as to what investors are actually doing at a certain point in time. Learn the 12 major candlestick patterns as well as the secondary patterns and your investments perceptions will greatly improve.

Sunday, March 17, 2013

Candlesticks: Homing Pigeon


Description
The homing pigeon is the same as the harami (see bullish harami and bearish harami signals), except for the color of the second day’s body. The homing pigeon is composed of a two-candle formation in a down trending market. Both candles are the same color as the current trend. The first body of the pattern is a long body and the second body is smaller. The open and the close of the second day occur inside the open and the close of the previous day. When a homing pigeon present itself it indicates that the trend is over.
Criteria for Homing Pigeon:
  • The body of the first candle is black (or red) and the body of the second candle is black (or red).
  • The downtrend is evident for a good period of time and a long black (or red) candle occurs at the end of the trend.
  • The second day opens higher than the close of the previous day, and closes lower than the open, but still above the closing price of the prior day.
  • Unlike the western inside day, just the body needs to remain in the previous day’s body. Please note that the inside day requires both the body and the shadows to remain inside the previous day’s body.
  • For a reversal signal, further confirmation is required to indicate that the trend is moving up.
Signal Enhancements for the Homing Pigeon
The higher the second candle closes up on the first black (or red) candle, the more convincing it is that a reversal occurred.
Pattern Psychology
After a strong downtrend has been in effect and after a long black (or red) candle, the bulls open the price higher than the previous close. The shorts get concerned and start to cover. The price finishes lower for the day but not as low as the previous day. This is enough support needed so that the short sellers take notice that the trend is violated. A strong day following would convince everyone that the trend is reversing. Usually the volume is above the recent norm due to the unwinding of short positions.