Showing posts with label NASDAQ. Show all posts
Monday, January 30, 2023
Nasdaq 100 on pace for best January since 1999
The Nasdaq 100 Stock Index is on pace for its best January since 1999 despite warning signs from the likes of Microsoft Corp. and Intel Corp. and another expected interest-rate hike from the Federal Reserve. The Cboe Volatility Index sank within striking distance of a 10-month low on Friday, signalling less angst in the market. Meanwhile, options trading on megacaps last week showed demand hasn’t jumped for protection against a selloff.
Labels:
NASDAQ,
Nasdaq 100,
Nasdaq 100 vs SPX,
Nasdaq 100 vs. Dow,
QQQ,
Russell 2000,
S&P 500
Wednesday, December 28, 2022
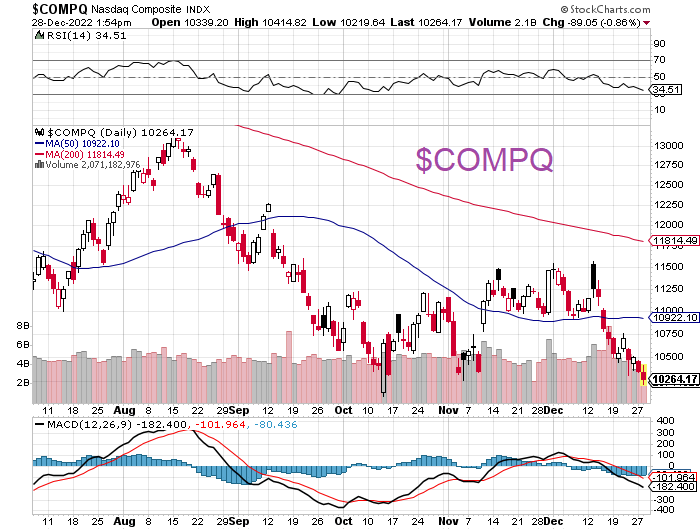
Market update: S&P 500 dips below 3,800 Dow dips below 33,000 (28 Dec 22)
S&P 500 dips below 3,800
Dow dips below 33,000
Nasdaq dips below 10,300
Labels:
Dow Jones,
market outlook,
NASDAQ,
S&P 500
Friday, June 10, 2022
Monday, May 2, 2022
Nasdaq 100 valuations return to pre-pandemic levels
The P/E ratio of the Nasdaq 100 has returned to pre-pandemic levels. In theory, that would indicate all the steam has been let out. But think back to the conversations investors were having in late 2019 and early 2020. It bore a resemblance to the same issues being talked about now: extreme valuations, a slow down in growth, a tight labor market and a prolonged rally thanks to Fed support.
If those concerns were surfacing at pre-pandemic valuations, then returning to those levels doesn't necessarily bolster the bull case as is the instinct to do. (Especially with the same issues.) Instead, it signals there may be more selling as markets recalibrate.
Monday, September 21, 2020
Market update: The S&P 500 corrects 10% from recent high (21 Sept 2020)
At its low today, the S&P 500 was down 10.0% from the record high it set earlier this month -- a decline often described as a "correction." This might have been the green light for many investors and traders to buy the dip in the last hour of trading.
YTD
- Nasdaq Composite +20.1%
- S&P 500 +1.6%
- Dow Jones Industrial Average -4.9%
- Russell 2000 -11.0%
Labels:
Dow Jones,
market outlook,
NASDAQ,
Russell 2000,
S&P 500
Monday, June 8, 2020
Market update: The S&P 500 turns positive for the year (8 June 2020)
The S&P 500 turned positive for the year and the Nasdaq Composite closed at a new all-time high.
YTD:
- Nasdaq Composite +10.6%
- S&P 500 +0.1%
- Dow Jones Industrial Average -3.4%
- Russell 2000 -7.9%
Labels:
$COMPQ,
Dow Jones,
market outlook,
NASDAQ,
Russell 2000,
S&P 500
Friday, January 31, 2020
Market update (31 January 20)
The stock market sold off to end the week, and month, on growing concerns about the coronavirus and the negative effect it could have on economic growth.
The coronavirus angst was exacerbated by increasing reports of worldwide cases; Delta Air Lines (DAL), United Airlines (UAL), and American Airlines (AAL) suspending U.S.-China flights; and the White House declaring a public health emergency in addition to announcing some travel restrictions.
Fri, Jan 31, 20
Worried by the mounting death toll from the coronavirus and drastic efforts to contain it, investors dashed for the exits,
coronavirus-related stocks on Fri Jan 31, 20
YTD
Nasdaq Composite +2.0%
S&P 500 -0.2%
Dow Jones Industrial Average -1.0%
Russell 2000 -3.3%
GSG commodity index, renko chart
The Economist, Bloomberg Businessweek covers
sold out masks at CVS
Latest coronavirus news:
- Chinese authorities have reported more than 350 fatalities
- China has banned burials or funerals for virus victims
- There are over 14,000 confirmed cases worldwide
- Hong Kong, Japan, Singapore, UAE and the US have confirmed more infections
- The outbreak has reached more than two dozen countries and regions globally
- Several countries are halting flights to and from China
- WHO declared the virus was a public health emergency of international concern
Update Tue Feb 4, 20: China injects $57 billion into banks
Labels:
coronavirus,
Dow Jones,
market outlook,
NASDAQ,
S&P 500,
SPY
Tuesday, March 19, 2019
Market update: key market catalysts (19 March 2019)
SPY daily and monthly
$SPX last 5 sessions
- Latest survey showed allocation to equities is at its lowest since September 2016. Implies many fund managers have missed/trailed the 2019 rally effort and will need to play catch up, providing more fuel to keep the rally going.
- Economic sentiment in Germany was better than expected in March and employment trends in the UK were also better than expected, highlighted by the lowest unemployment rate (3.9%) since 1975, according to Reuters.
- The reassuring data helped stoke the narrative that the global economy may be bottoming (or has bottomed), which has driven buying interest in cyclical sectors.
- This industry group is regarded as having leading indicator status, so it resonates as a positive marker that the Philadelphia Semiconductor Index is up 21.9% year-to-date, including today's 1.4% gain.
- Strength in the semis has been a key source of support for the information technology sector (+0.3%), which is the market's most heavily-weighted sector.
- The stock market knows the Fed is on its side at the moment. On Wednesday, it expects the FOMC to reinforce that position by holding the fed funds rate steady and reiterating a patient mindset.
- This expectation, and the speculation that the dot plot will show a reduced rate-hike projection for 2019 (the median estimate in December called for two rate hikes), and that the Fed could announce a plan regarding the timing for ending its balance sheet runoff, have helped keep selling interest in check.
Today, President Trump welcomed the recently elected President of Brazil, Jair Bolsonaro, to the White House.
President Bolsonaro’s election marked a historic opportunity for the United States and Brazil—the two largest democracies in the Western Hemisphere—to build a new partnership focused on increased prosperity, strong security, and national sovereignty.
Perhaps most important, Brazil is a crucial ally in President Trump’s stand against the corrupt, socialist Maduro dictatorship in Venezuela. President Bolsonaro reiterated that Brazil stands with Venezuelan Interim President Juan Guaido, as well as with the democratically elected National Assembly and the Venezuelan people in their fight against tyranny.
“The twilight hour of socialism has arrived in our hemisphere,” President Trump said from the Rose Garden this afternoon. “And hopefully, by the way, it’s also arrived—that twilight hour—in our great country.”
“I have always admired the United States of America,” President Bolsonaro added. “And this sense of admiration has just increased after you took office.”
President Trump said he will designate Brazil as a major non-NATO ally during the visit of Brazil's President Jair Bolsonaro to the White House. Argentina is the only other South American country with that designation.

President Jair Bolsonaro, left, presents Donald Trump with a Brazil national football jersey after the US leader gave him a US soccer team shirt
Labels:
Brazil,
Dow Jones,
market outlook,
NASDAQ,
Russell 2000,
S&P 500,
SPY
Friday, October 6, 2017
Market outlook : 6 Oct 2017 - NASDAQ 100 ($NDX)
The bullish ascending triangle pattern has cleared on the NDX:
Momentum is just beginning to accelerate from its launch near centerline support. The top of the triangle is at 6000 and the initial low in the pattern was approximately 5750. That difference, 250 points, is the measurement, which is added to the breakout level at 6000 to establish an initial target of 6250. Expect to see that rather quickly. To the downside, the two key support levels will now be the breakout level and rising 20 day EMA at 6000 and 5962, respectively. Look to those levels to hold and for buyers to re-emerge during any short-term period of selling.
Tuesday, September 13, 2016
Tuesday, February 2, 2016
Friday, January 9, 2015
Sunday, December 7, 2014
Sunday, November 9, 2014
Sunday, October 5, 2014
Sunday, September 7, 2014
Sunday, August 3, 2014
Sunday, May 4, 2014
Sunday, April 6, 2014
Sunday, March 2, 2014
Subscribe to:
Posts (Atom)