Showing posts with label S&P 500. Show all posts

Monday, January 30, 2023

Nasdaq 100 on pace for best January since 1999

The Nasdaq 100 Stock Index is on pace for its best January since 1999 despite warning signs from the likes of Microsoft Corp. and Intel Corp. and another expected interest-rate hike from the Federal Reserve. The Cboe Volatility Index sank within striking distance of a 10-month low on Friday, signalling less angst in the market. Meanwhile, options trading on megacaps last week showed demand hasn’t jumped for protection against a selloff.


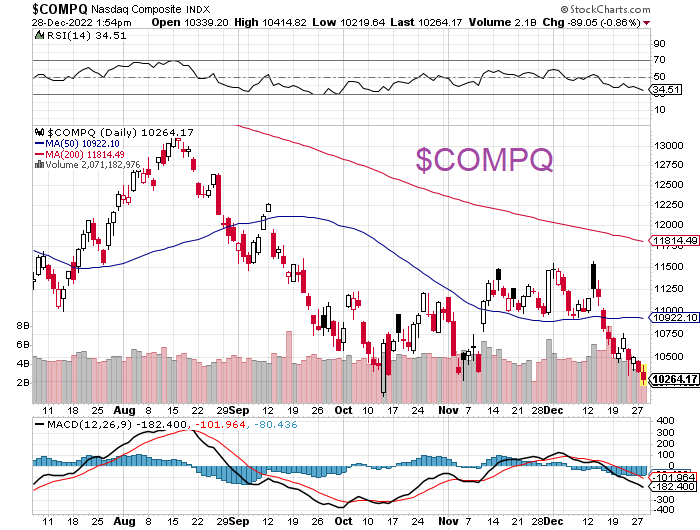
Wednesday, December 28, 2022

Friday, December 23, 2022

2022 duration of declines the worst since 1977

While the 25% peak-to-trough drop in the S&P 500 ranks in the lower range of bear-market wipeouts, it took a particularly jagged route to get there. At 2.3 days, the average duration of declines is the worst since 1977. Throw in three separate bounces of 10% or more and it was a market where hopefulness was squeezed as in few years before it.


This may explain why despite a smaller drawdown, pessimism by some measures rivals that seen in the financial crisis and the dot-com crash. Safety crumbled in government bonds, which failed to provide a buffer for beat-up equities. Buying put options as a way to hedge losses didn’t work either, adding to trader angst.

While stocks headed to the Christmas break with a modest weekly decline, anyone hoping for the rebound from October lows to continue in December bounce has been burned. The S&P 500 slipped 0.2% in the five days, bringing its loss for the month to almost 6%.

That would be just the fourth-worst month of the year in a market that at times has seemed almost consciously bent on wringing optimism out of investors. Downtrends have been drawn out and big up days unreliable buy indicators. Consider a strategy that buys stocks one day after the S&P 500 posts a single-session decline of 1%. That trade has delivered a loss of 0.3% in 2022, the worst performance in more than three decades.

“There’s an old saying on Wall Street to ‘buy the dip, and sell the rip,’ but for 2022, the saying should be ‘sell the dip, and sell the rip,’” Justin Walters, co-founder at Bespoke Investment Group, wrote in a note Monday.

It’s a stark reversal from the prior two years, when dip buying generated the best returns in decades. For people still conditioned to the success of the strategy — and until recently, many were — 2022 has been a wakeup call.

“There was nowhere to hide for a whole year — that’s a big issue,” Mohamed El-Erian, chief economic adviser at Allianz SE and Bloomberg Opinion columnist, said on Bloomberg TV. “It’s not just returns, it's correlation and volatility that have hit you in a big way. Is it done? No, it’s not.”

Monday, December 5, 2022

The US dollar and the S&P 500 at their 200dma


($USD live, $SPX live)

Dow Jones Industrial Average: -5.3% YTD
S&P Midcap 400: -9.4% YTD
Russell 2000: -15.7% YTD
S&P 500: -14.6% YTD
Nasdaq Composite: -26.7% YTD

Tuesday, November 1, 2022

Island Reversal

An Island Reversal features a grouping of days separated on either side by gaps in the price action. This price pattern suggests that prices may reverse whatever trend they are currently exhibiting, whether from upward to downward or from downward to upward.
  • This price pattern occurs when two different gaps isolate a cluster of trading days.
  • An island reversal changing from upward trending prices (bullish) to downward trending prices (bearish) is much more frequent than the opposite.
  • Short-term exhaustion;  overbought / oversold conditions. (Also see: outside day)

An island reversal on June 11, 2020:


3 months later: the market did move higher, but 


the breadth was poor (small number of stocks participated):


Thursday, June 16, 2022

Market update: Federal Reserve hikes short-term rates by 0.75% (15 June 22)

S&P 500 after the Fed's 75-basis point rate hike yesterday, which was the largest move in 28 years.

Several central banks elsewhere also raising their key rates:  the Swiss National Bank surprised overnight with a 50-basis point rate hike (its first hike in 15 years), Brazil's central bank raised its key lending rate by 50 basis points, and the Bank of England increased its key lending rate by 25 basis points while projecting a 0.3% decline in Q2 GDP as a whole. 


Wednesday, May 4, 2022

Market update: Federal Reserve hikes short-term rates by 0.50% (4 May 2022)

The Federal Reserve increased short-term interest rates on Wednesday, as expected, raising the fed funds target range by 50 basis points to 0.75-1.00%the biggest increase in 22 years.  The stock market surged and Treasury yields fell as Fed chief Jerome Powell signaled supersize rate hikes are off the table in June and July.


Fed chief Powell says it's crucial that inflation is brought down quickly. But Powell said he sees rate hikes of "50 basis points" on the table for the next couple of Fed meetings. He added that policymakers aren't actively considering 75 basis points. Markets had priced in a good chance of three-quarters of a point hikes at the June and July Fed meetings.

Fed chief Powell's less-hawkish-than-feared rate-hike forecast sent stocks sharply higher and Treasury yields lower.

Dow Jones Industrial Average -6.3% YTD
S&P 500 -9.8% YTD
Russell 2000 -13.2% YTD
Nasdaq Composite -17.1% YTD

 
 All 11 S&P 500 sectors closed higher with gains ranging from 1.1% (real estate) to 4.1% (energy). Ten sectors advanced more than 2.0%.


 ** The following day **
 

Monday, December 20, 2021

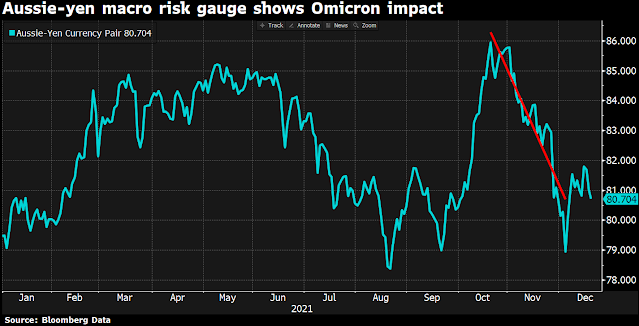
Aussie-Yen creates roadmap for S&P 500

The Aussie serves as the “risk-on” piece because the country is the top global exporter of iron ore, among other commodities, and its primary trading partner is China. The Japanese Yen serves as the “risk-off” part, as Japanese assets often capture haven flows. The pair is also highly liquid, with both currencies among the five most traded in the world. Taken together, their global exposure through commodity, credit and FX markets can create a road map for other risk assets -- like the S&P 500. 
 
The Australian Dollar or "Aussie" versus the Japanese Yen
 
The chart shows the Auussie-Yen has been in a downtrend over the last two months since the Omicron variant headlines broke. And that's likely to continue into the holidays with thin liquidity and light trading volume. Add on this latest variant's rapid spread (and the global lockdowns that come with it) as well as the loss of Senator Joe Manchin's support for Biden's Build Back Better Plan (something that the market was counting on) and it suggests that maybe that traditional holiday "Santa Rally" for risk assets like the stock market is in jeopardy.

Monday, November 29, 2021

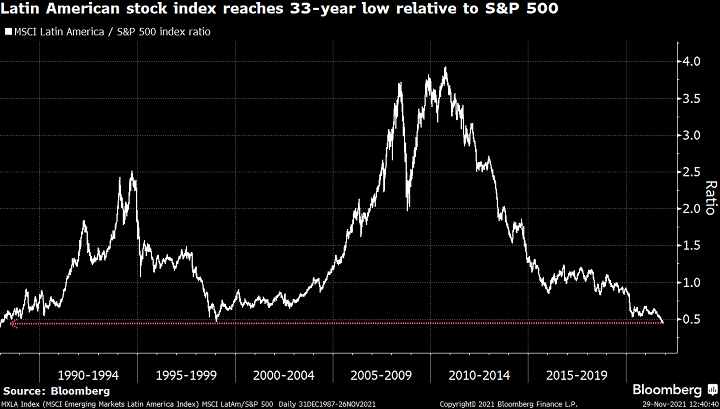
Latin America vs S&P 500

South America has gone south for U.S. stock investors, and so has Central America. That’s evident from the ratio between the MSCI Emerging Markets Latin America Index and the S&P 500 Index -- a gauge that Michael Hartnett, Bank of America Corp.’s chief global equity strategist, highlighted in a report Wednesday. MSCI’s index closed Friday near the lowest level relative to the U.S. benchmark since January 1988, according to data compiled by Bloomberg. The low was set on Nov. 18 after the ratio plunged 89% from a record high in October 2010.
 

Tuesday, August 24, 2021

U.S. bonds fall out of sync with record-setting S&P 500

Signals from the U.S. bond market indicate the S&P 500 Index is due for “a reset,” according to Steven Vannelli, chief investment officer of Knowledge Leaders Capital LLC. Vannelli, also the firm’s founder and chief executive, raised the issue in a blog post Thursday. 


He cited gaps in yield between investment-grade and high-yield debt and U.S. Treasuries, as compiled by Bloomberg. Both spreads widened because of falling bond prices since early July, while the S&P 500 set records repeatedly. There have been 49 new highs this year.

Tuesday, August 17, 2021

S&P 500 has doubled from its March 2020 low

Now that the S&P 500 has doubled from its March 2020 low, what's next? 
A pullback if history is any guide.

Friday, August 13, 2021

Gold's standard-free 50 years leave metal behind S&P 500

Gold has a golden anniversary Sunday. Fifty years will have passed since President Richard Nixon said the U.S. government would no longer convert dollars into the precious metal at $35 an ounce, which effectively ended the gold standard

While the metal generally had bigger gains since that time than the S&P 500 Index, there was no comparison between the two after accounting for dividends, according to data compiled by Bloomberg. The S&P 500’s total return approached 20,000% this week, while gold returned about 4,200%.


Friday, August 6, 2021

S&P 500 is seen reaching 6,000 in 2025

Wall Street strategists are making increasingly optimistic predictions for the S&P 500 Index, which closed Thursday at 4,429.10. Goldman Sachs Group Inc.’s David Kostin is now calling for 4,900 at the end of next year. Yardeni Research Inc.’s Edward Yardeni is targeting 5,000. Leuthold Group Inc.’s Jim Paulsen is looking out further, to 2025, and seeing a bigger round number: 6,000. Paulsen raised the possibility in a report Thursday that assumed the U.S. economy will grow for the next four years. His projection values the S&P 500 at 20 times earnings per share of $300.


Wednesday, August 4, 2021

For S&P 500 stocks, triple-digit prices are now the rule

Share prices of more than $100 were once unusual among companies in the S&P 500 Index. Only 30 stocks were at or above the threshold when the U.S. equity benchmark peaked in March 2000, for instance, according to data compiled by Bloomberg. 
 
Now more than half of S&P 500 stocks are in triple digits, as shown by their median price, which surpassed $100 in February and has risen every month since then. 

Four-digit prices are more commonplace as well. Intuitive Surgical Inc. became the eighth company in the index to exceed $1,000 a share on Tuesday, though it closed just below that price.
Tuesday, January 12, 2021

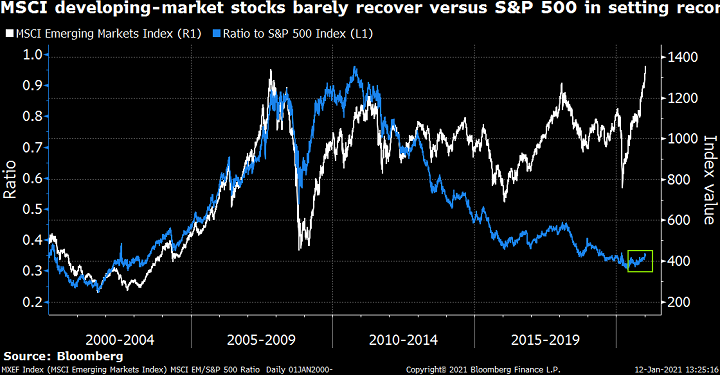
Emerging market stocks barely regain strength with record

 Emerging-market stocks have barely begun to overcome a decade of relative weakness even after breaking a 13-year-old record last week. A comparison between the MSCI Emerging Markets Index and the S&P 500 Index shows as much. While the developing-country gauge set a new high Friday, the index ended the week having recovered only 7% of a plunge relative to the S&P 500 from October 2010 through last May.


A reversal “appears to have only just begun,” Willie Delwiche, a strategist at Robert W. Baird & Co., wrote Monday in a Twitter post with a similar chart.

Monday, September 21, 2020

Market update: The S&P 500 corrects 10% from recent high (21 Sept 2020)

At its low today, the S&P 500 was down 10.0% from the record high it set earlier this month -- a decline often described as a "correction." This might have been the green light for many investors and traders to buy the dip in the last hour of trading. 

YTD

  • Nasdaq Composite +20.1% 
  • S&P 500 +1.6% 
  • Dow Jones Industrial Average -4.9% 
  • Russell 2000 -11.0% 


Wednesday, August 26, 2020

S&P 500's mega-cap companies

The S&P 500 Index’s biggest companies are far from regaining the strength they showed 20 years ago. That’s evident from the ratio between the S&P 500 and an equally weighted version, which counts each stock the same. The ratio tumbled 53% between March 2000 and April 2015 on a total-return basis, which includes dividends, according to data compiled by Bloomberg. Since then, the gauge has only recouped about a fifth of its decline. “Long-term history isn’t necessarily kind to owning mega cap” stocks, Jim Reid, a global strategist at Deutsche Bank AG, wrote Tuesday in a note with a similar chart.


Thursday, July 30, 2020

Five biggest companies in the S&P 500

There’s a distinction to be made between the S&P 500 Index’s five biggest companies and all the rest, according to BCA Research. The firm compared the total market value of the five -- Amazon.com Inc., Apple Inc., Facebook Inc., Google owner Alphabet Inc. and Microsoft Corp. -- with the value of the other 495 companies in a chart last week. The top five’s value increased 266% from the start of 2015 through Tuesday, according to data compiled by Bloomberg. In the same period, the value of the rest rose just 25% -- and the entire gain occurred after the S&P 500 set this year’s low in March.


Thursday, July 16, 2020

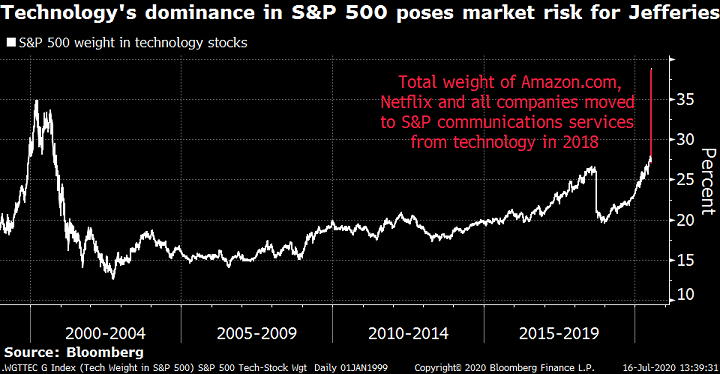
Technology looks too top-heavy in S&P 500 for Jefferies

Technology stocks have become so top-heavy within the S&P 500 Index that they pose a risk for the broader market, according to Sean Darby, Jefferies Group Inc.’s chief global equity strategist. Darby raised the issue in a report Wednesday after estimating that technology accounts for 40% of the S&P 500, above a peak in March 2000. The figure reflects the total weight of companies in the S&P 500 Technology Index along with Amazon.com Inc. and Netflix Inc., which Darby cited though they aren’t in the industry gauge, and companies such as Facebook Inc. that were removed in 2018.

Wednesday, June 10, 2020

Market update: The Fed keeps interest rates unchanged (10 June 20)

The Federal Reserve kept the target range for the fed funds rate unchanged at 0.00-0.25%, and its dot plot signaled rates will remain near zero through at least 2022
The Fed's economic projections called for a 6.5% contraction in 2020 GDP, followed by 5.0% growth in 2021. Core PCE inflation is expected to remain below the Fed's 2.0% target through 2020. 


After the release of the policy directive, the S&P 500 erased prior losses and gained as much as 0.5%, but stocks quickly retraced those gains during Fed Chair Powell's press conference. Mr. Powell didn't say anything particularly new, reiterating the Fed's commitment to supporting the economy, but he did subtly urge Congress to do more. 

In the Treasury market, longer-dated maturities saw greater demand following the FOMC statement. The 2-yr yield declined three basis points to 0.17%, and the 10-yr yield declined eight basis points to 0.75%. The U.S. Dollar Index declined 0.3% to 96.02. WTI crude gained 1.6%, or $0.62, to $39.54/bbl.

Nasdaq Composite +11.7% YTD
S&P 500 -1.3% YTD
Dow Jones Industrial Average -5.4% YTD
Russell 2000 -12.1% YTD