Showing posts with label energy. Show all posts

Tuesday, November 8, 2022

Energy vs. Technology 2020-2022

Energy sector (blue) is decisively outperforming Tech (orange).
Performance spread now at +23%


Saturday, February 12, 2022

U.S. becomes world's largest exporter of liquefied natural gas (LNG)

The U.S. became the world’s No. 1 exporter of liquefied natural gas for the first time ever, as deliveries surged to energy-starved Europe. 
  • On Saturday, Febr. 12, 2022, all seven U.S. LNG export terminals had tankers docked or loading for the first time, with much of the gas headed to Europe.

  • Out of the roughly 60 LNG cargoes on the water, more than two-thirds are headed to Europe.

  • Demand for U.S. exports helped set a record 13.3 billion cubic feet of gas loading at the LNG export terminals.

Ship-tracking data compiled by Bloomberg: out of the roughly 60 LNG cargoes on the water, more than two-thirds are headed to Europe.

All seven U.S. LNG export terminals had tankers docked or loading for the first time,

A shale gas revolution, coupled with billions of dollars of investments in liquefaction facilities, transformed the U.S. from a net LNG importer to a top exporter in less than a decade. 

U.S. LNG export terminals sent out a record 1,043 cargoes in 2021, with Asian nations making up nearly half of the destinations and Europe making up one-third, ship tracking data compiled by Bloomberg shows.

Europe 
Overall, Europe gets about a third of its natural gas from Russia. About a quarter of that gas travels via pipelines routed through Ukraine.


Supplies through Poland to Germany, through the Russian Yamal-Europe pipeline, have largely been shut down since December. As of late January, Russian gas supplier Gazprom (OGZPY) had cut flows of Russian gas through Ukraine to just a quarter of what they were in 2019, Citigroup estimated.

The Algeria/Spain Liquefied Natural Gas Connection
Europe faces other supply snags. Algeria is the third-largest source of natural gas for Europe, delivering about 18% of supplies. The bulk of that gas flowed through the subsea Maghreb — Europe pipeline between Morocco and Spain until early November. Then Algeria shut down the flow due to a dispute with Morocco.

Algeria has tried to make up the difference to Spain by increasing the flow through a smaller, alternate line into the country. It has boosted its LNG deliveries to the country, which is home to about a third of the LNG re-gasification capacity in Europe.

The liquefied natural gas shipments ease the energy hit taken by Spain, but they add further stress to an already tight global market.

While most natural gas comes to Spain from the south, half of Germany's supply comes from Russia.

Meanwhile, the U.K. receives about half of its natural gas from fields in the North and Irish seas. Another third is piped in from Norway, with much of the remainder shipped in as liquefied natural gas.

Europe's LNG Capacity
Russia, Algeria and Norway all send natural gas into Europe via pipelines. But any gas supplied from further abroad must arrive by sea. That involves a much more complex process.

Liquefied natural gas is natural gas that is piped into export facilities, where it is supercooled to -260°F. That converts it into liquid form, after which it is stored in cryogenic tanks. Companies like Flex LNG haul the fuel between continents in sophisticated LNG carriers, effectively massive refrigerated tanker ships.

At their destination, the liquefaction process is reversed. The LNG is offloaded and turned back into a gas via a process called re-gasification.

U.S. Takes Global LNG Export Lead
In the U.S., Cheniere is the leader in LNG production. It is rapidly rising to challenge the world's largest producer, Exxon's Qatargas partnership with Qatar Petroleum.

Cheniere (LNG) owns 49% of Cheniere Energy Partners (CQP). CQP, in turn, owns Sabine Pass, which is the largest U.S. export facility by a wide margin.

Cheniere expanded the Louisiana export facility, launched in 2016, to take advantage of the growing LNG markets. A sixth train, or liquefaction production unit, turned out its first export cargo in December.

Since the start of January, 50 ships have delivered LNG from the facility to Europe, about 70% of Cheniere's total output, according to comments made by Chief Executive Jack Fusco to Reuters.

Sabine Pass reportedly took in record gas flows of 5.1 billion cubic feet on Jan. 20 and 21, according to Bloomberg. One billion cubic feet of gas can supply one day's worth of gas to about five million U.S. homes. The site can produce 30 million metric tons per year of LNG, converting more than 4.7 billion cubic feet per day of natural gas into liquefied exports.

Cheniere's Calcasieu Pass export facility operates 18 trains, with total annual capacity of 12 million metric tons.

Asian Vs. European Spot Market
The U.S. is the world's largest supplier of spot, or flexible, LNG, according to Wyeno. That is thanks to export contracts that allow for destination flexibility.

Normally Asia receives the majority of global LNG spot cargoes because it is the premium-priced spot market during the winter. Japan and South Korea have little domestic natgas production and storage capacity and must import large quantities of LNG.

China
Last year China overtook Japan as the world's largest LNG importer. The U.S. is the second-largest supplier for China's fix, according to data from Kpler LNG, even as tensions between Washington and Beijing simmer.

But ahead of the Beijing Winter Olympic Games, Russia's Putin brokered a 30-year deal with Chinese President Xi Jinping to supply natgas to China via a new pipeline, signaling a strengthened alliance. The deal could buffer Gazprom revenue in the event of lost exports to Europe. Revenues from oil and gas sales fund a reported 40% of Russia's federal budget.

U.S. capacity
U.S. liquefied natural gas (LNG) export capacity has grown rapidly since the Lower 48 states first began exporting LNG in February 2016. In 2019, the United States became the world’s third-largest LNG exporter, behind Australia and Qatar. Once the new LNG liquefaction units, called trains, at Sabine Pass and Calcasieu Pass in Louisiana are placed in service by the end of 2022, the United States will have the world’s largest LNG export capacity.


More info at

Wednesday, February 9, 2022

Energy stocks get the spotlight

Since the start of 2022, the S&P 500 is down ~4% with tech leading the way lower. And energy is surging, up 24%. The jump in oil prices is playing a role as demand increases, tensions in Russia and parts of the Middle East create geopolitical risk and investors remain concerned about limited OPEC+ supply. However the stocks are even outperforming the 19% rise in West Texas Intermediate crude and Brent’s 18% climb. 

Thursday, October 21, 2021

Drilling-rig gauge is seen working for U.S. energy stocks

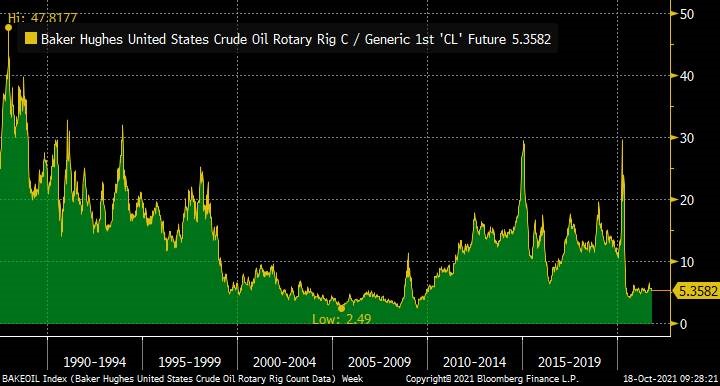
Energy stocks stand to benefit from the U.S. industry’s “underinvestment” as oil and natural gas become more expensive, according to Richard Bernstein Advisors. The money manager made the case Monday in a Twitter post, citing the ratio between the number of drilling rigs in operation and the crude-oil price.

 
There were 445 rigs at work in the U.S. last Friday, according to data that Baker Hughes Co. compiles weekly. That’s equivalent to 5.4 times last week’s settlement price for West Texas Intermediate crude in New York trading. The ratio has averaged 12.1 times since 2010. 


The oil rig/oil price ratio reflects underinvestment similar to the 2000s when energy was the decade’s best performer.

Tuesday, May 18, 2021

Energy stocks turning the corner

“What’s old is new” when it comes to U.S. energy stocks, according to Jonathan Krinsky, chief market technician at Bay Crest Partners LLC. Krinsky compared two exchange-traded funds in a report Sunday to make his case. He cited the ratio between the SPDR S&P Oil & Gas Exploration & Production ETF and the First Trust Nasdaq Clean Energy Green Energy ETF, which plunged 97% between October 2012 and last November. Since then, the ratio has more than doubled. Oil and gas “looks timely to us,” Krinsky wrote, after the SPDR ETF stalled in the past two months.

Tuesday, March 30, 2021

S&P 500's tech stocks turn into dead weight for a change

Technology stocks rarely trail the rest of the S&P 500 Index’s main industry groups for a quarter. It’s even less common for the index to rise when tech ranks last out of the 11 sectors. Yet both are poised to happen this quarter. The S&P 500 Information Technology Index is in position for its second last-place finish since 2008, according to data compiled by Bloomberg for the first quarter. During the same period, the S&P 500 rose 5.4%. Any advance would be the first since 2004 for a quarter when tech, which has the S&P 500’s highest weight at 26%, was the biggest laggard.


Monday, February 22, 2021

Energy stocks, Treasury yields send U.S. inflation signal

Energy stocks and Treasury securities are sending similar signals about the U.S. inflation outlook, according to Michael Hartnett, Bank of America Corp.’s chief global investment strategist. He cited gains among “energy laggards,” specifically Occidental Petroleum Corp., and higher Treasury yields in a report Friday. The chart makes a wider comparison between the S&P 500 Energy Index and the yield on 10-year notes, which have both worked their way higher since March. “Trends say higher inflation,” Hartnett wrote, and commodities and other real assets are reaping the benefits.


Friday, October 9, 2020

Buying oil stocks, selling solar is seen as winning trade

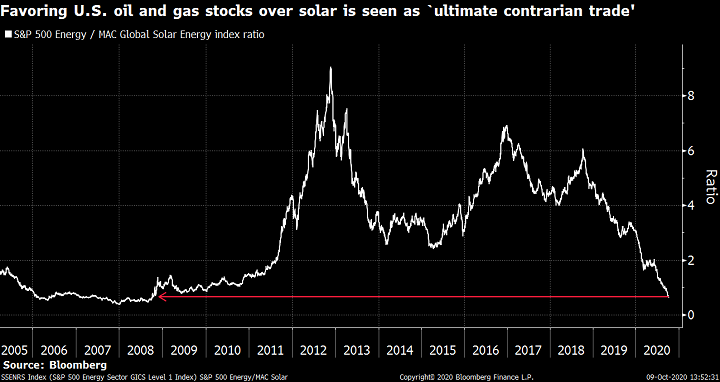
Owning U.S. oil and gas producers and betting against solar companies looks like “the ultimate contrarian trade” to Jonathan Krinsky, Bay Crest Partners LLC’s chief market technician. Krinsky suggested the stock trade in a report Thursday, based on a comparison between the S&P 500 Energy Index and the MAC Global Solar Energy Index. The ratio between the industry gauges closed Wednesday at the lowest level since October 2008, according to data compiled by Bloomberg. Wednesday’s reading was 90% below a peak reached two years ago, and Krinsky wrote that he sees the potential for a “sharp snapback.


Tuesday, September 22, 2020

Finance, energy trail S&P 500 tech weight more than 2000

Financial and energy stocks, once dominant within the S&P 500 Index, are taking even more of a back seat to technology shares than they did as a bull market ended 20 years ago. The two industry groups together have trailed the weight of the S&P 500 Technology Index by as much as 17 percentage points this month, according to data compiled by Bloomberg. That’s less than a point away from a low in March 2000 -- a figure that isn’t adjusted for a September 2018 index shift, which lifted the ratio by 5.1 points in just one day. Bespoke Investment Group LLC highlighted the comparison in a blog post Monday.


Friday, March 27, 2020

U.S. energy stocks weakest since the Great Depression

U.S. energy stocks are weaker than they have been since the Great Depression, according to Michael Hartnett, Bank of America Corp.’s global chief investment strategist. 

Hartnett cited a ratio between oil and gas shares and the S&P 500 Index in a report Thursday. 


The comparison was based on the S&P 500 Energy Index, calculated since 1990, and an earlier industry gauge from Global Financial Data. S&P’s index set a record low relative to the S&P 500 on March 18 after plummeting 85% from a record in July 2008. 
Investors who go against their peers “would buy some U.S. oil stocks,” he wrote.

Wednesday, March 11, 2020

S&P 500 energy index signals risk to industry's dividends

Occidental Petroleum Inc.’s first dividend cut in 30 years may have set a precedent, if the S&P 500 Energy Index is any guide. Two weeks ago, the index’s dividend yield surpassed a record of 4.9% that had stood since 1992, according to data compiled by Bloomberg. The yield rose above 7% Monday as the industry gauge suffered the biggest loss in its 30-year history. Tumbling oil prices helped drive up the yield and prompted Occidental to slash its payout by 86% in an effort to conserve cash.

Friday, February 7, 2020

S&P 500 energy vs tech at lowest level since March 2000

Energy producers have almost completed a 20-year round trip relative to technology companies within the S&P 500 Index. The ratio between their S&P 500 industry-group indexes fell this week to its lowest level since March 2000, when an Internet-driven bull market peaked. The low followed the ratio’s 87% retreat from a high in July 2008, when oil traded at a record $147.27 a barrel in New York. “Can energy stage a rally while tech falls? We think so,” Jonathan Krinsky, chief market technician at Bay Crest Partners LLC, wrote Wednesday in a report that highlighted the ratio.

Tuesday, September 17, 2019

Energy stocks play a diminishing role in the S&P 500 Index

Energy stocks have played a diminishing role in the S&P 500 Index for years, and a rally Monday did little to reverse the trend. The industry’s weight in the S&P 500 has plummeted as much as 73% from a record in July 2008, according to data compiled by Bloomberg. Oil and gas producers and service companies fell last month to their lowest share of the index’s value, 4.37%, since the S&P 500 Energy Index was first calculated in 1989. The group’s weight rose Monday by 0.16 percentage point, to 4.72%, as the index itself climbed 3.3%.
 

Thursday, February 14, 2019

Commodity stocks seen as 'catch-up trade' at JPMorgan

Shares of commodity producers look like a “catch-up trade” for anyone who missed a post-Christmas rally in U.S. stocks, according to Marko Kolanovic, JPMorgan Chase & Co.’s global head of quantitative and derivatives strategy. “This could present an opportunity to capture potential progress on China trade negotiations,” Kolanovic wrote in a report Thursday. Energy and raw-material companies in the S&P 500 Index dropped more than the benchmark from its Sept. 20 peak through Thursday, according to data compiled by Bloomberg.

Thursday, November 15, 2018

UBS: Energy stocks have dividend yields on their side

Losses among energy stocks have led to a “value point,” according to Keith Parker, head of U.S. equity strategy at UBS Group AG. In a report Wednesday, he cited the gap between dividend yields on the S&P 500 Energy Index and two other indicators, the S&P 500 and the index’s materials group. They exceeded a percentage point during the past month, which Parker cited as his threshold for value. He raised his rating on energy to overweight and recommended a pair trade: investing in the group and betting against raw-material producers.


Wednesday, November 14, 2018

Energy stocks approach 15-year low relative to S&P 500

U.S. energy stocks have gone from bad to worse during an unprecedented decline in oil prices. The share-price ratio between the Energy Select Sector SPDR and SPDR S&P 500 exchange-traded funds closed Tuesday at its lowest level since December 2003, according to data compiled by Bloomberg. The shares’ weakness points to potentially much greater downside for crude,” Callum Thomas, founder and head of research at Topdown Charts, wrote in a blog post Monday with a similar chart. Oil futures have fallen for the past 12 trading days, the longest streak ever, in New York trading.


Tuesday, November 7, 2017

Oil is breaking out & energy stocks are catching up

“If you like what you see in the oil markets, then you’ll love what you see among energy companies,” Bryce Coward, a money manager at Knowledge Leaders Capital LLC, wrote in a blog posting Monday. Coward estimated that energy stocks in developed markets would have to rise about 20 percent to catch up with crude prices, which have risen to two-year highs.


The chart illustrates the gap by using MSCI stock indexes and Brent crude.

Friday, August 4, 2017

Energy stocks seen getting help from lower dollar


The dollar’s retreat this year may lead to a rebound in U.S. energy stocks, according to Jim Paulsen, Leuthold Group Inc.’s chief investment strategist. Paulsen compared the U.S. Dollar Index, which fell 9.6 percent for the year through Wednesday, with the ratio between the S&P 500 Energy Index and the S&P 500 in a report Monday. The dividend-adjusted ratio dropped last week to its lowest level since January 2004. “Energy stocks could be market leaders again for a period” as long as the dollar declines further, he wrote.

Saturday, March 12, 2016